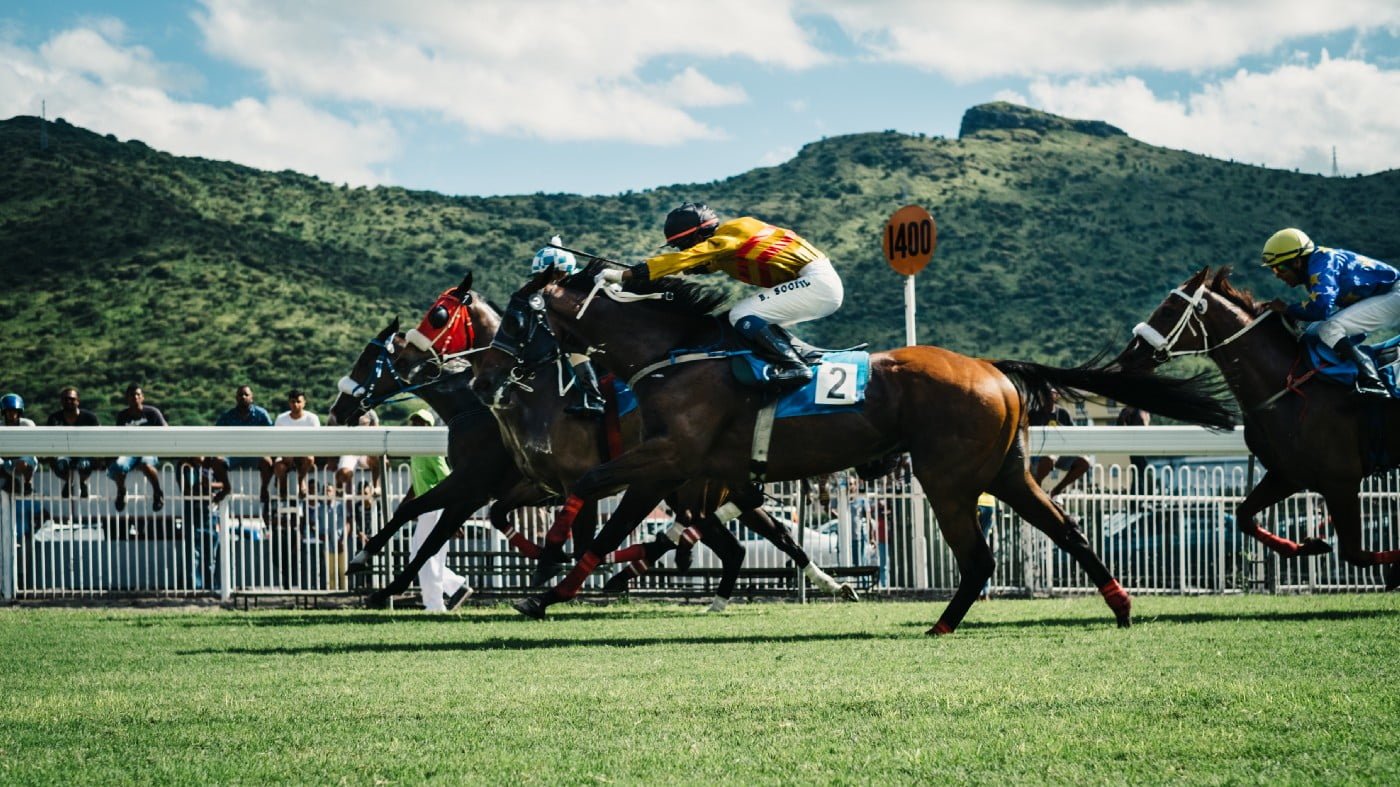
Why Hong Kong Horse Racing?
In this article, we are going to describe what makes machine learning a great element for beating public betting odds on horse racing.
One of the great machine learning problems is the availability of data.
There are multiple data sources that provide structured tabular data for each historical race which has hundreds of columns, with an affordable season subscription on https://horseracedatabase.com where you can get all historical data from a relational horse racing database.
Another interesting phenomenon is Hong Kong’s pari-mutuel betting pools, that the odds are determined by market forces rather than bookies.
Any machine learning enthusiasts might be able to build a system to bet on horses with an edge over mom and pop bettors.
Further, other than betting on the winning horse, there are also several types of bets for each horse race:
- Win — 1st in a race.
- Place — 1st, 2nd, or 3rd in a race with 7 or more declared starters or 1st, 2nd in a race with 4, 5, 6 declared starters.
- Quinella — 1st and 2nd in either order in the race.
- Quinella Place — Any two of the first three placed horses in any finishing order in the race.
- Trio — 1st, 2nd, and 3rd in any order in the race.
- Tierce — 1st, 2nd, and 3rd in the correct order in the race.
- First Four — 1st, 2nd, 3rd, and 4th in any order in the race. (Merged pool with Quartet)
- Quartet — 1st, 2nd, 3rd, and 4th in the correct order in the race. (Merged pool with First Four)
Data
In the current dataset, there are a total of around 1800 races, and each race has 6–14 horses competing.
Data spans from 2018 to 2021 and contains more than 2 full seasons with sectional times on races. The racing season begins after summer each year in September and ends in July.
Each line of data represents one horse in each race and contains all the information about that particular horse, including the market odds.
Some description about the data:
- 2 racetracks in Hong Kong Horse Racing; each racetrack has multiple distances.
- 5 classes of race
- 6–14 horses per race
Below is a small sample of the tabular data

One way to tackle a prediction problem is to throw all the available factors into a machine learning model and hope for the best.
Moreover, I think the best approach is to first understand the mechanics of horse racing, so at least understand fundamentally what is important in determining the winner of a race — a “quanta-mental” approach that has been trending in the finance industry.
Here are some factors that I think they are fundamentally important:
Rating
Firstly, The rating of a horse, which is available publicly on websites. This could change every race for the same horse.
Horses are assigned to different race classes based on their ratings in Hong Kong.
The below shows the distribution of ratings by race class; there are some overlaps in the classifications.

Weight
Secondly, The weight that the horse is carrying, including jockey’s weight and extra weight. To maintain fairness, higher rating horses are carrying more weights.

Number of Races
Thirdly and most importantly, this factor describes how many races the horse has run. In conclusion, we would expect horses with a higher number of races would have better performance.

How do the above factors relate, and can these be used as a factor in any machine learning model? A quick and simple way is to look at their correlation matrix.
                 FP       Rating     Weight    Number of Races
FP               1.000000 -0.050983 -0.098313 -0.034951
Rating          -0.050983  1.000000  0.153349 -0.086086
Weight          -0.098313  0.153349  1.000000 -0.063662
Number of Races -0.034951 -0.086086 -0.063662  1.000000
FP means final position of a race; horses that have won will have FP equals to 1.
All 3 of the presented factors have a negative correlation to FP; so in other words, the higher the Rating, Weights, and Number of Races of the horse, the better it will perform in any race.
What’s surprising is that Weight also has a negative correlation to FP, one might expect the more weights it carries, the slower it runs. Nonetheless, the correlation says otherwise.
Other interesting factors include age of horse, draw of the race, jockey’s track record, horse’s track record etc.
Read full article at https://medium.com/@ham_curl/hong-kong-horse-racing-prediction-part-1-6d3fca131316
2 Responses
Machine learning using tensorflow is the most used and reliable tool ever to this
I was excited to uncover this site. I need to to thank you for your time for this particularly wonderful read!! I definitely savored every part of it and I have you saved to fav to see new stuff in your site.