


Ten questions to put to any horse racing data provider, with a test for each one you can run on a sample file in an afternoon.
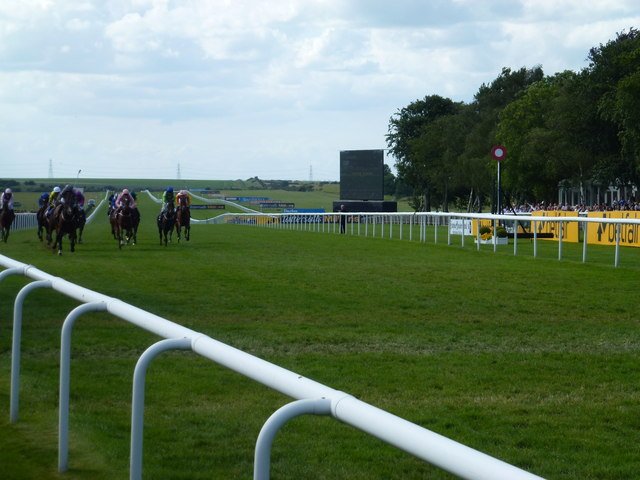
A set of plain statistics measured on our own UK, Irish and Hong Kong results: how big the fields are, how often horses fall, and how short most careers are.

UK race distances are text, there are about 1,900 of them, and the surface column is not what its name suggests. A practical guide with the real counts.

Why analysts keep coming back to racing as a dataset, and the honest limits that come with each of its strengths.

Which UK and Irish racecourses stage the most races? We counted every race since 2011. The answer is not the famous ones.

The Hong Kong Jockey Club publishes veterinary notes on its horses. We hold 53,966 of them. This is what they contain and how to use them in an analysis.

The tables behind racing data, how they join, and two traps: IDs that only mean something inside one market, and profile totals that quietly look into the future.

The distance between runners is the messiest column in racing results. This is how UK and Hong Kong write it, and how to turn it into a number.

A horse racing data pipeline is two jobs, not one: a big one-off load of history and a small daily job. Here is how to build both and what the daily job costs.
Recent Comments